pricegenerator.PriceGenerator
PriceGenerator is the platform for generating prices similar to real stock prices, but you can control the statistics of their distribution. Generates chain of candlesticks with predefined statistical parameters, return Pandas DataFrame or saving as .CSV-file with OHLCV-candlestick in every string. Use PriceGenerator to generate synthetic data to test your trading strategy.
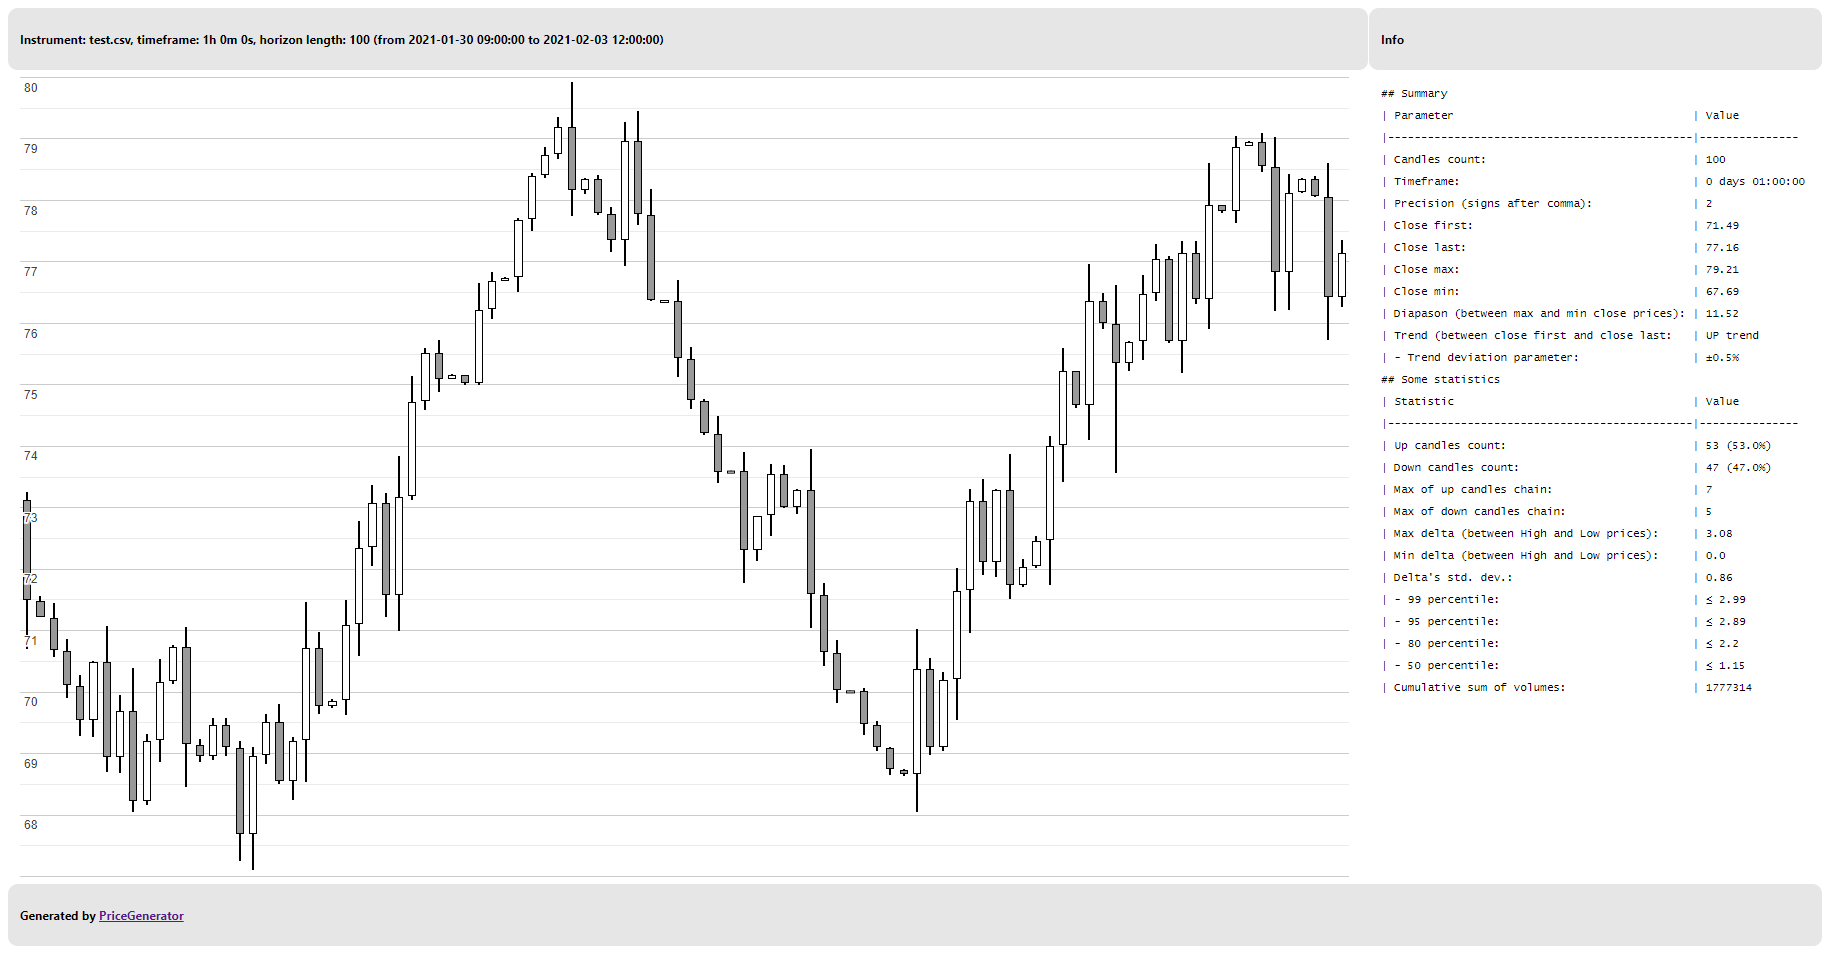
In additional you can view some statistical and probability parameters of generated or loaded prices.
Sample example:
This class implements methods to generation of prices statistically similar to real ones.
Model generated: OHLCV-candlesticks (open, high, low, close, volume).
Headers in .CSV-file. Default: ["date", "time", "open", "high", "low", "close", "volume"].
Headers in Pandas DataFrame. Default: ["datetime", "open", "high", "low", "close", "volume"].
Full path to custom jinja2 html-template file (e.g. google_template_example.j2) or just set here a long multi-string variable. Default: GOOGLE_TEMPLATE_J2 is a multi-string variable with internal template.
Dictionary of variables for jinja2 template. If None then used default variables for internal GOOGLE_TEMPLATE_J2
Candlesticks count in generated or loaded chain of prices, must be >= 5. Default: None (means auto-detect length of chain if loaded from file).
Set different trends, e.g. trendSplit="/\-" means that generated candles has uptrend at first part, next downtrend and then no trend. Used only together with splitCount variable. Also, you can use words: up, down, no or chars: u, d, n with the hyphen symbol as separator, e.g. trendSplit=up-down-no-up, trendSplit=u-d-n-u etc. Default: "", empty string mean that will be used random trend directions.
Set candles count in different trends, e.g. splitCount=[5, 10, 15] means that generated candles has 3 trends with 5, 10 and 15 candles in chain, with sum must be equal to horizon. Used only together with trendSplit variable. Default: [], empty list mean that will be used random candles count in trends.
Maximum size of outliers. If None then used value (maxClose - minClose) / 10. Default: None.
Maximum of candle body sizes: abs(open - close). If None then used value maxOutlier * 90%. Default: None.
Relative deviation for trend detection. "NO trend" if (1st_close - last_close) / 1st_close <= self.trendDeviation. Default: 0.005 (means ±0.5% of price deviation).
Relative deviation to detection next points used by Zig-Zag indicator. Default: 0.03 (means 3% of price deviation).
Pretty format for timedelta objects.
Example: FormattedDelta(timedelta(days=2, hours=3, minutes=15, seconds=35), "{days} days {hours}:{minutes}:{seconds}") -> "2 days 3:15:35".
Returns
timedelta object formatted as a string.
Auto-detect precision from example values. E.g. 0.123 -> 3, 0.12345 -> 5 and so on.
This method change precision variable after detect precision.
See also about statistics.mode: https://docs.python.org/3.9/library/statistics.html#statistics.mode Changed in Python version >= 3.8: Now mode() method handles multimodal datasets by returning the first mode encountered. Previously, it raised StatisticsError when more than one mode was found.
Parameters
- examples: chain with examples of float values.
Auto-detect time delta between last two neighbour candles.
Returns
timedelta object, also saved to
timeframe.
Create Pandas OHLCV-model from CSV-file.
Default columns in CSV-file are ["date", "time", "open", "high", "low", "close", "volume"].
Parameters
- fileName: path to CSV-file with OHLCV columns.
Returns
Pandas DataFrame.
Save Pandas OHLCV model to CSV-file.
Parameters
- fileName: path to CSV-file.
Get string with trend: "UP trend", "DOWN trend" or "NO trend".
Parameters
- firstClose: close of first candle.
- lastClose: close of last candle.
- trendDeviation: relative deviation for trend detection, 0.005 mean ±0.5% by default.
Returns
string with trend direction
"NO trend","UP trend"or"DOWN trend".
This method filter input data as Zig-Zag indicator: when input value of candlestick price (e.g. close price) is difference with next values with define percent then this point is a point of Zig-Zag indicator.
Parameters
- datetimes: input Pandas Series with datetime values.
- values: input Pandas Series or list, e.g. list of closes values of candlesticks.
- deviation: float number in
[0, 1]interval is a relative difference betweeniandi + 1values to set as Zig-Zag point.
Returns
Pandas DataFrame with two Series of filtered data
"datetimes": filtered_datetimesand"filtered": filtered_values.
Calculates statistics of candles chain.
Returns
list with text in Markdown format with statistics.
Main method to generating prices.
:return Pandas DataFrame object with OHLCV-candlestick in every row and also saving it to the prices.
Rendering prices from Pandas DataFrame as OHLCV Bokeh chart of candlesticks and save it to HTML-file.
Pandas DataFrame in prices variable must contain "datetime", "open", "high", "low", "close" and "volume" columns.
See also: https://docs.bokeh.org/en/latest/docs/gallery/candlestick.html
Parameters
- fileName: HTML-file path to save Bokeh chart.
index.htmlby default. - viewInBrowser: If
True, then immediately opens HTML chart in browser after rendering.Falseby default. - darkTheme: chart theme.
Falseby default, mean that will be used light theme,Falsemean dark theme. - markers: Pandas DataFrame with additional markers that will be placed on main series.
Noneby default. Marker is a custom symbol, example: ×, ↓ or ↑. Dataframe with markers must contain at least two columns. There aredatetimewith date and time and some markers columns (markersUpper,markersCenterormarkersLower). Length of markers series must be equal to the length of main candles series. - lines: list with custom series, where additional chart-lines will place on main series.
Noneby default. Line data must contain at least two columns. There aredatetimewith date and time andcustom_line_namewith y-coordinates. Length of the chart-line dataframes must be equal to the length of main candle series. - title: specific chart title. If
None, then used auto-generated title.Noneby default. - width: chart width. If
None, then used auto-width. 1800 px by default. - height: chart height. If
None, then used auto-height. 940 px by default. - showControlsOnChart: enable controls block in legend to hide/show some elements on chart,
Trueby default. - showStatOnChart: show statistics block on chart,
True(by default) mean that will be calculating additional series, like as Trend and Average Points. And some classical indicators, like as SMA, HMA, VWMA, Bollinger Bands, Parabolic Stop and Reverse, Alligator and Zig-Zag indicator. Warning! Calculate statistic takes more time. If you want to decrease chart rendering time, then set this parameter toFalse. - inline: if
True, then output chart in Jupyter Notebook cell.Falseby default.
Returns
bokeh.layouts.gridplot with all layouts objects or None.
Rendering prices from Pandas DataFrame as non-interactive Google Candlestick chart and save it to HTML-file.
See also: https://developers.google.com/chart/interactive/docs/gallery/candlestickchart
Parameters
- fileName: HTML-file path to save Google Candlestick chart.
- viewInBrowser: If
True, then immediately opens html in browser after rendering. - title: specific chart title. If
None, then used auto-generated title.Noneby default.
This function get and parse command line keys.
Main function for work with PriceGenerator in the console.
See examples:
- in english: https://github.com/Tim55667757/PriceGenerator/blob/master/README.md
- in russian: https://github.com/Tim55667757/PriceGenerator/blob/master/README_RU.md